Introducing Orderflows Tails
Put The Power Of The Order Flow Footprint Chart To Work For You
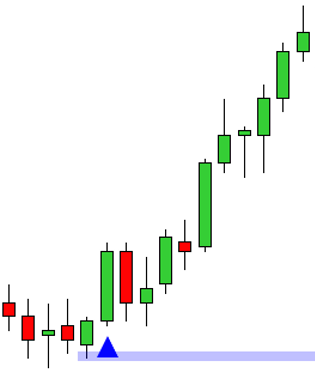
Tails are the result of traders getting too long or too short at a level.
Now With The Orderflows tails indicator, what was only visible on an order flow chart is now visible on you normal candlestick chart.
The Orderflows Tails is one of the many proprietary tools built into the Orderflows Trader 5.0 software and highlights to traders areas where traders are either too long (selling tail) or too short (buying tail). However, we have received many requests to make a stand alone indicator for this tool that can be used together with automated trading tools such as Markers or for traders who don't use a footprint chart or Orderflows Trader 5.0.
Order flow is real-time, time sensitive, evolving data base that displays data in its structural form. Normal candlestick charts are one-dimension, while the order flow charts is two-dimensional and allows a trader to view the market in greater depth. Order flow allows a trader to see patterns in trading that are made due to heavy participation or lack of participation.
Tails occur because traders get trapped, caught offside, because they are too anxious to get into a trade and try and predict what will happen next because of greed. Instead of letting the bar develop and let the trade appear they end up taking a very speculative trade. Ironically, the actions of the anxious traders not just leave them in a bad trade but to order flow traders a good trading opportunity appears, a buying or selling tail, based on the footprints left by the anxious traders.
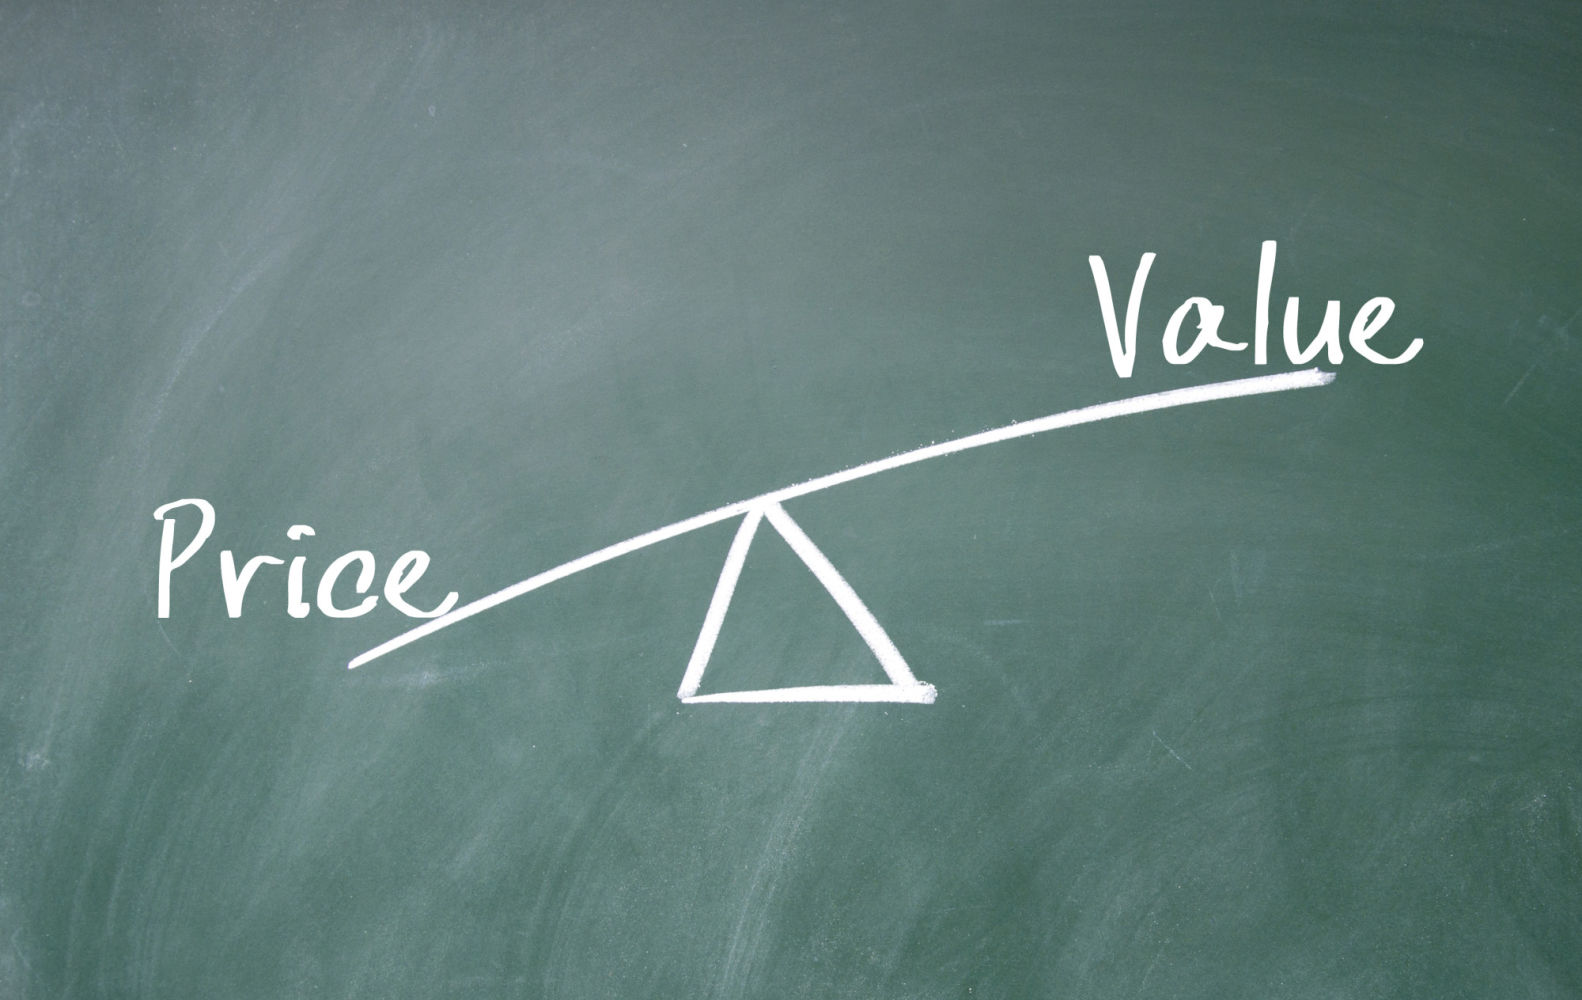
For most traders, their main focus for determining market movement is by analyzing price. The problem is that price is an after effect of market activity. If you really want to know where the market has the potential to trade to, a trader has to understand what is happening in the order flow. The key is to stop looking at the market in terms of price, but rather to look at the market based on the activity (trading) or lack of activity (trading) taking place.
The problem with most technical indicators is that they don't take into account order flow conditions. Most technical indicators simply take current price activity and compare it to previous price activity. It is based almost entirely on price. There is no consideration to as to whether the market is doing what it is supposed to do - facilitate trade. This is seen through the order flow, the volume traded on the bid and volume traded on the offer. Because of the lack of awareness to what is trading in the market, pure technical indicators often incorrectly higher prices as a sign of market strength or lower prices as a sign of market weakness, when in fact under the current market conditions those high or lows may be showing signs of market excess causing a rejection of those new highs or new lows. As a result, higher highs with less trade facilitation give experienced order flow traders and opportunity to get short, while technical traders, seeing only price go higher without regards to volume and trading activity, see market strength and continue buying in anticipation of higher prices only to be caught offsides, long at the swing high and the market turns starts trading lower.
Intraday movements are not random occurrences. Intraday trends begins with turning points at the micro level and are often visible in the order flow in certain circumstances.
Tails occur because traders get trapped, caught offside, because they are too anxious to get into a trade and try and predict what will happen next because of greed. Instead of letting the bar develop and let the trade appear they end up taking a very speculative trade. Ironically, the actions of the anxious traders not just leave them in a bad trade but to order flow traders a good trading opportunity appears, a buying or selling tail, based on the footprints left by the anxious traders.
For most traders, their main focus for determining market movement is by analyzing price. The problem is that price is an after effect of market activity. If you really want to know where the market has the potential to trade to, a trader has to understand what is happening in the order flow. The key is to stop looking at the market in terms of price, but rather to look at the market based on the activity (trading) or lack of activity (trading) taking place.
The problem with most technical indicators is that they don't take into account order flow conditions. Most technical indicators simply take current price activity and compare it to previous price activity. It is based almost entirely on price. There is no consideration to as to whether the market is doing what it is supposed to do - facilitate trade. This is seen through the order flow, the volume traded on the bid and volume traded on the offer. Because of the lack of awareness to what is trading in the market, pure technical indicators often incorrectly higher prices as a sign of market strength or lower prices as a sign of market weakness, when in fact under the current market conditions those high or lows may be showing signs of market excess causing a rejection of those new highs or new lows. As a result, higher highs with less trade facilitation give experienced order flow traders and opportunity to get short, while technical traders, seeing only price go higher without regards to volume and trading activity, see market strength and continue buying in anticipation of higher prices only to be caught offsides, long at the swing high and the market turns starts trading lower.
Intraday movements are not random occurrences. Intraday trends begins with turning points at the micro level and are often visible in the order flow in certain circumstances.
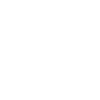
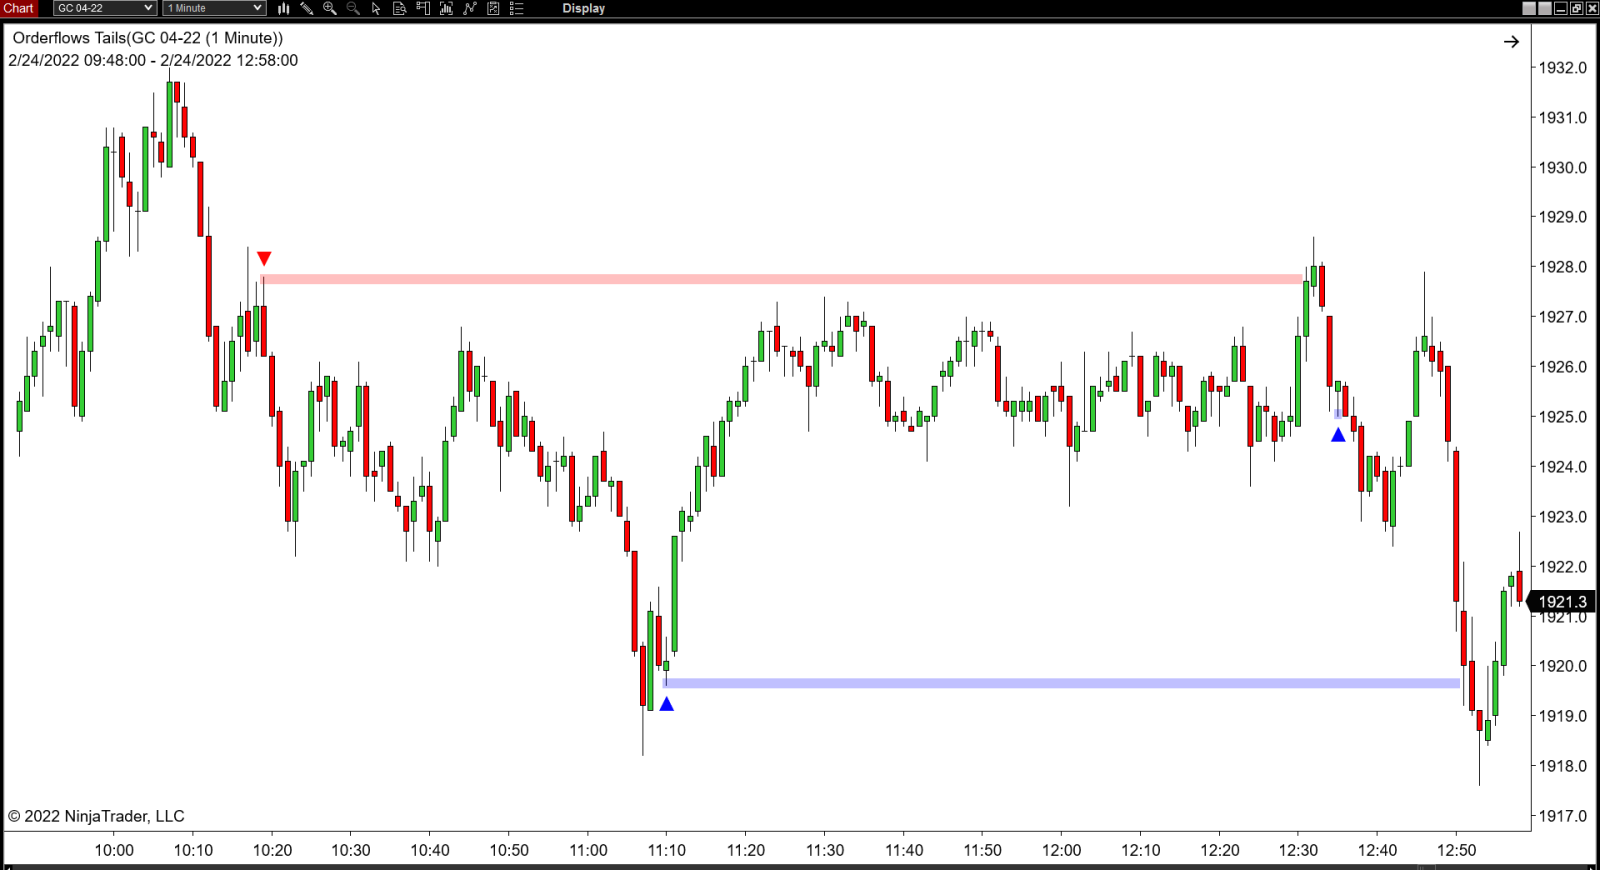
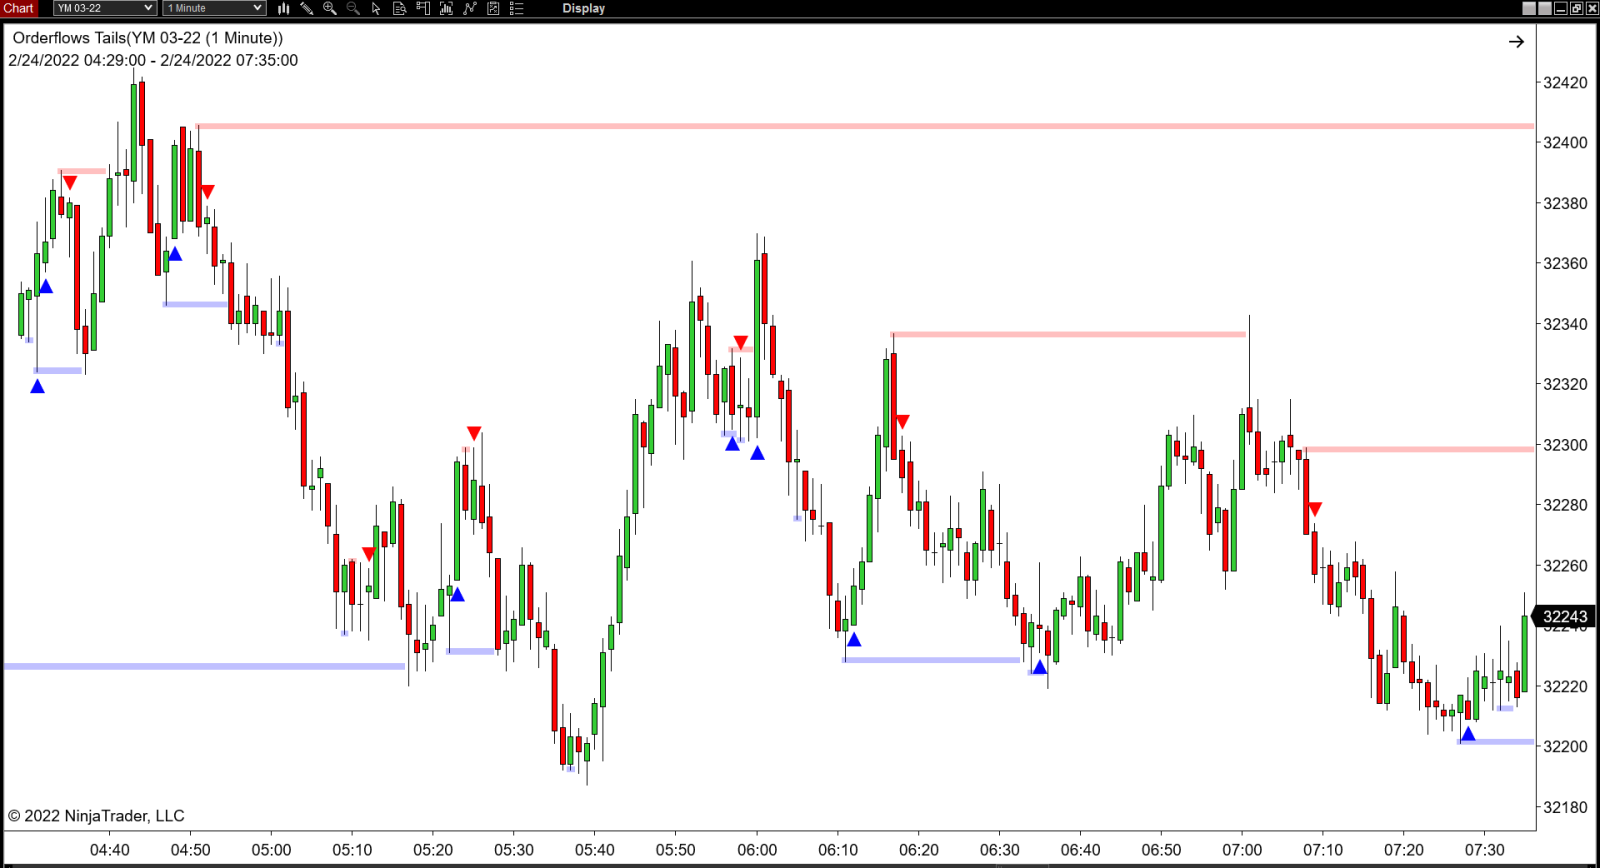
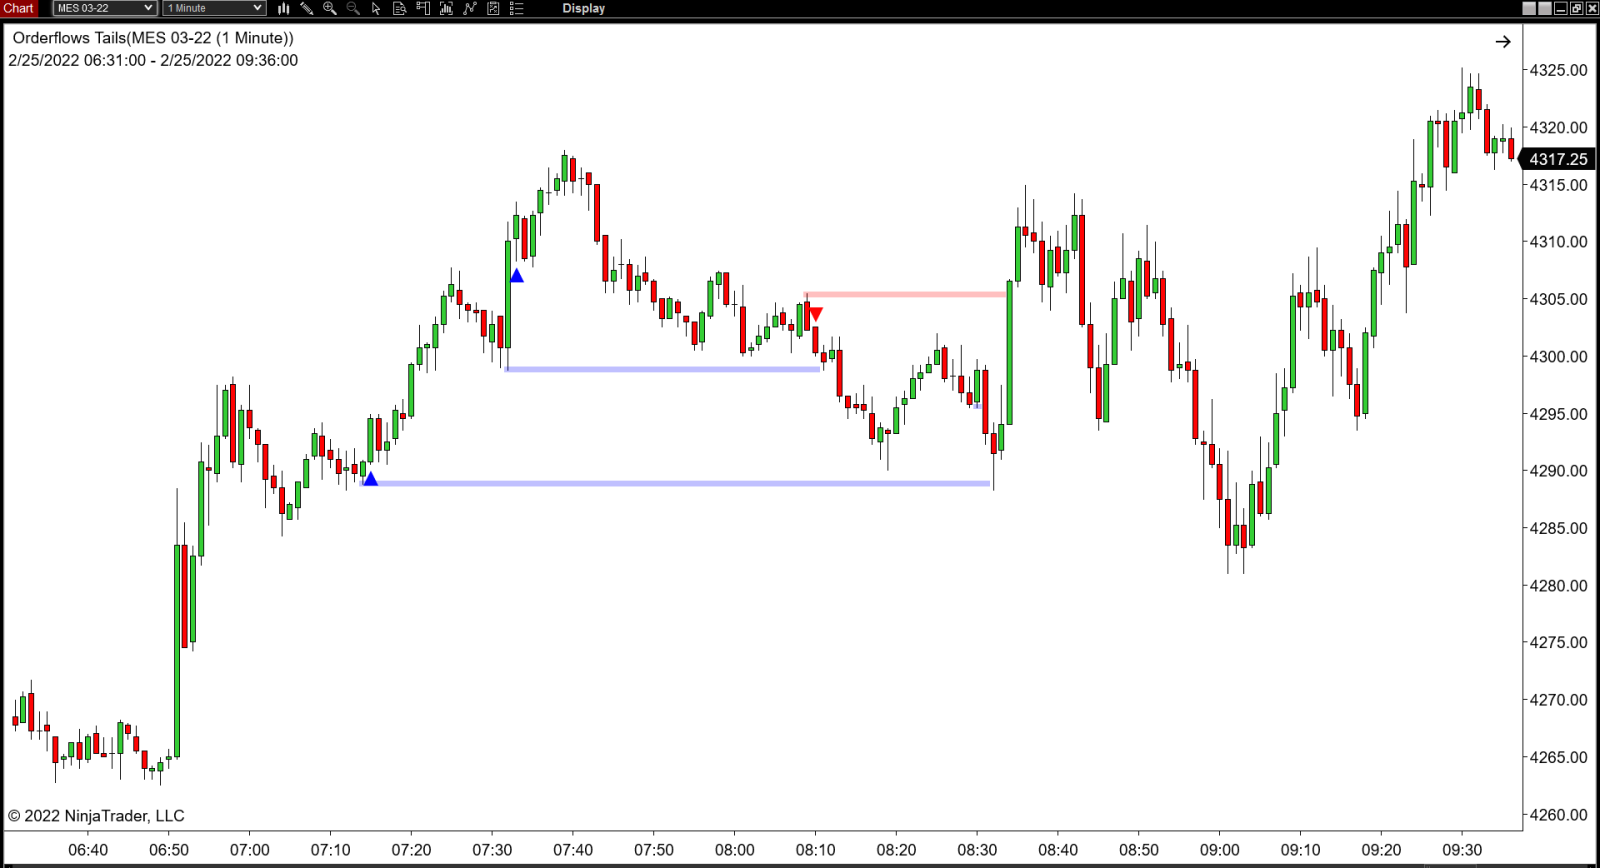
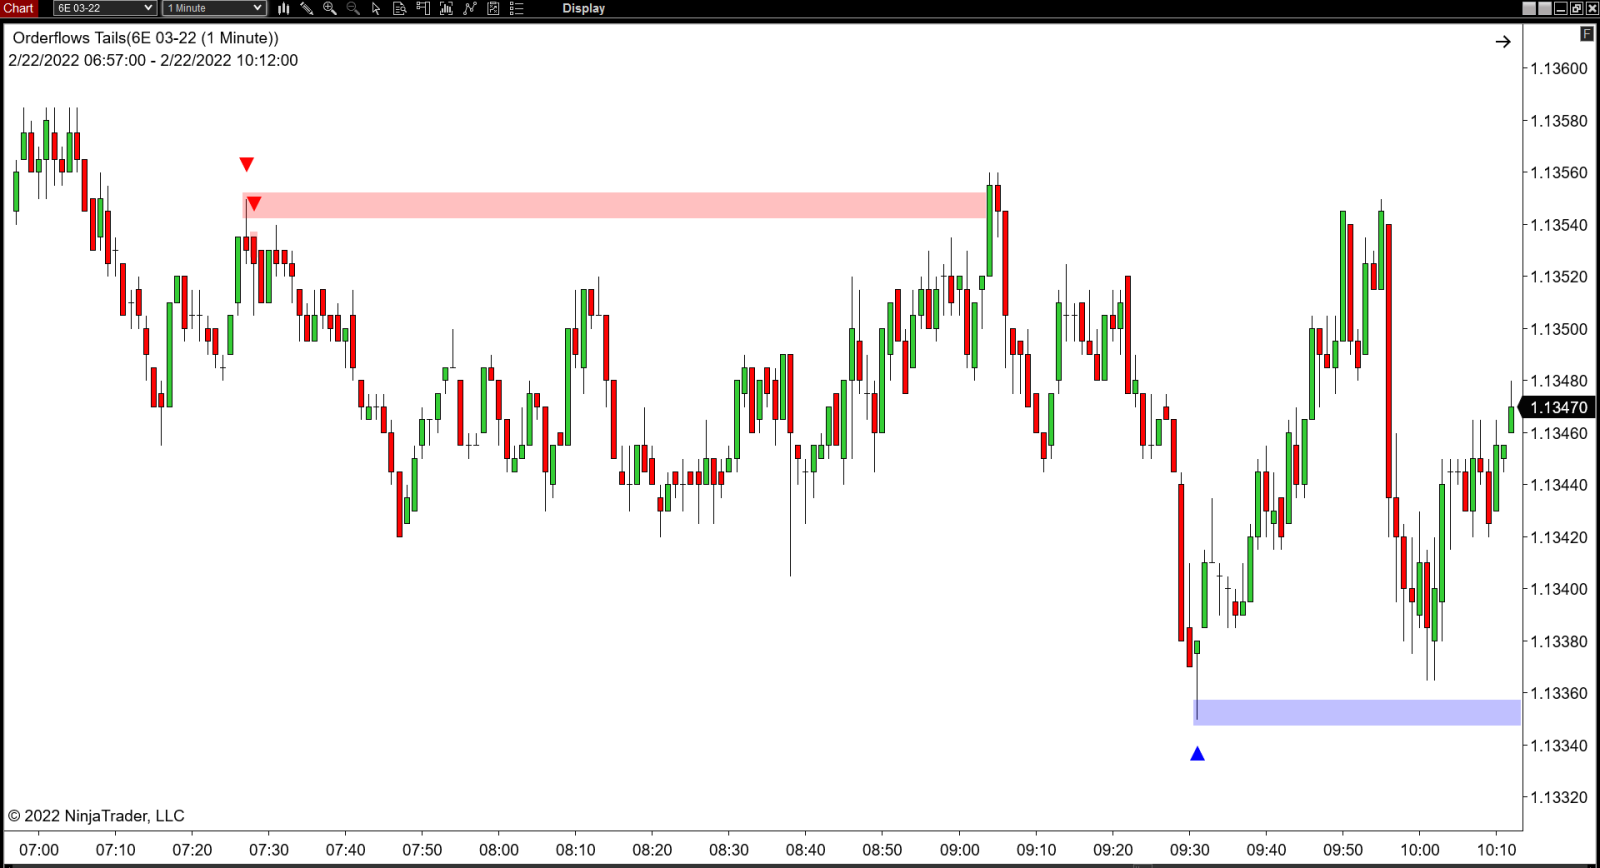
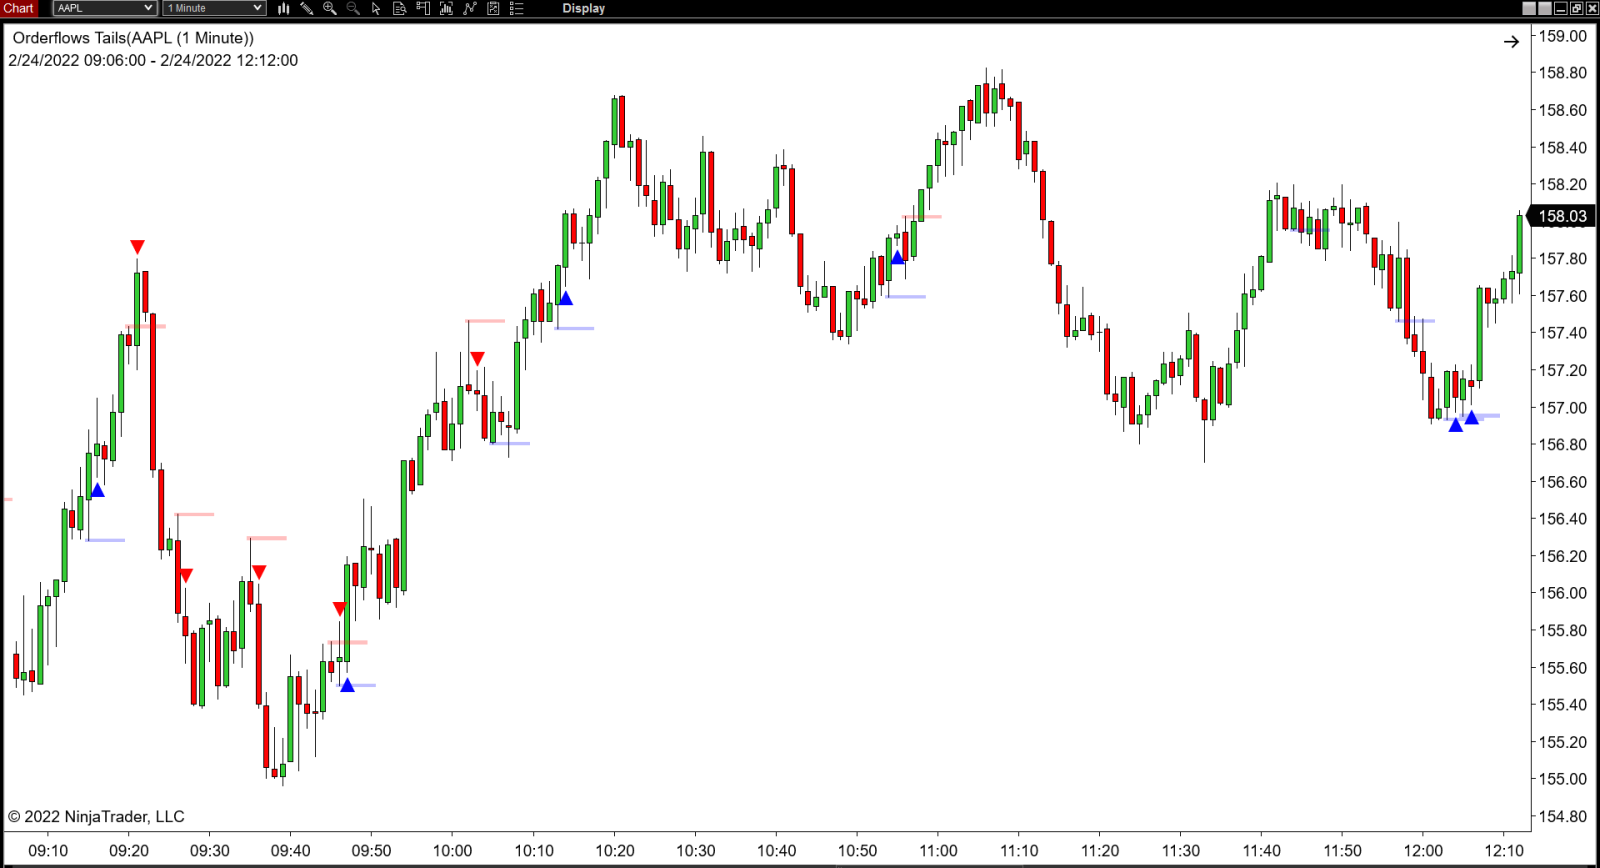
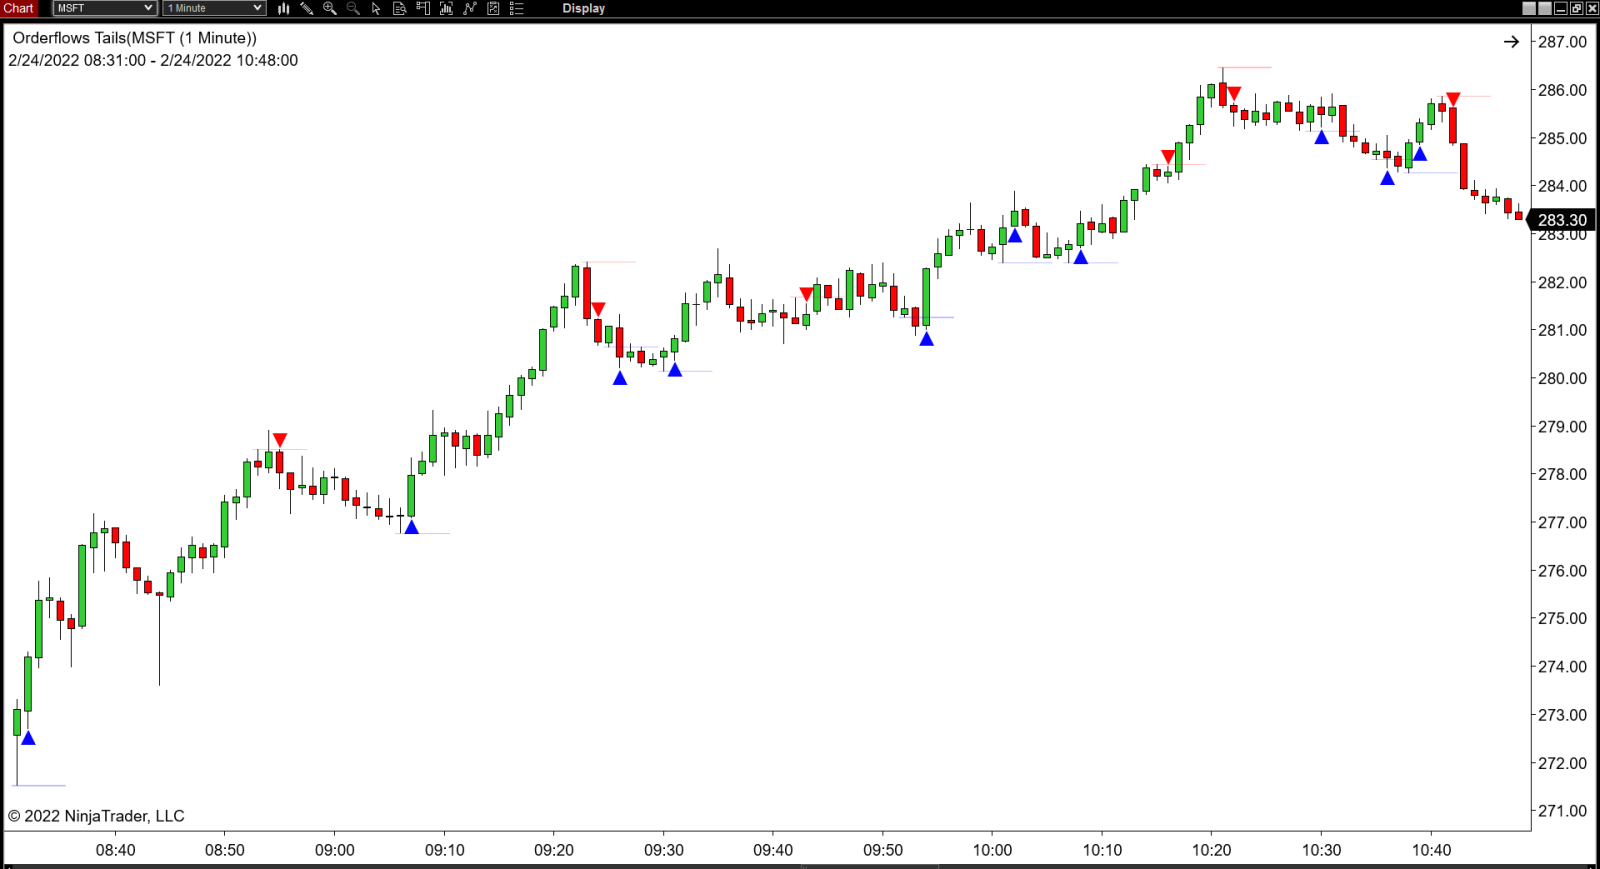
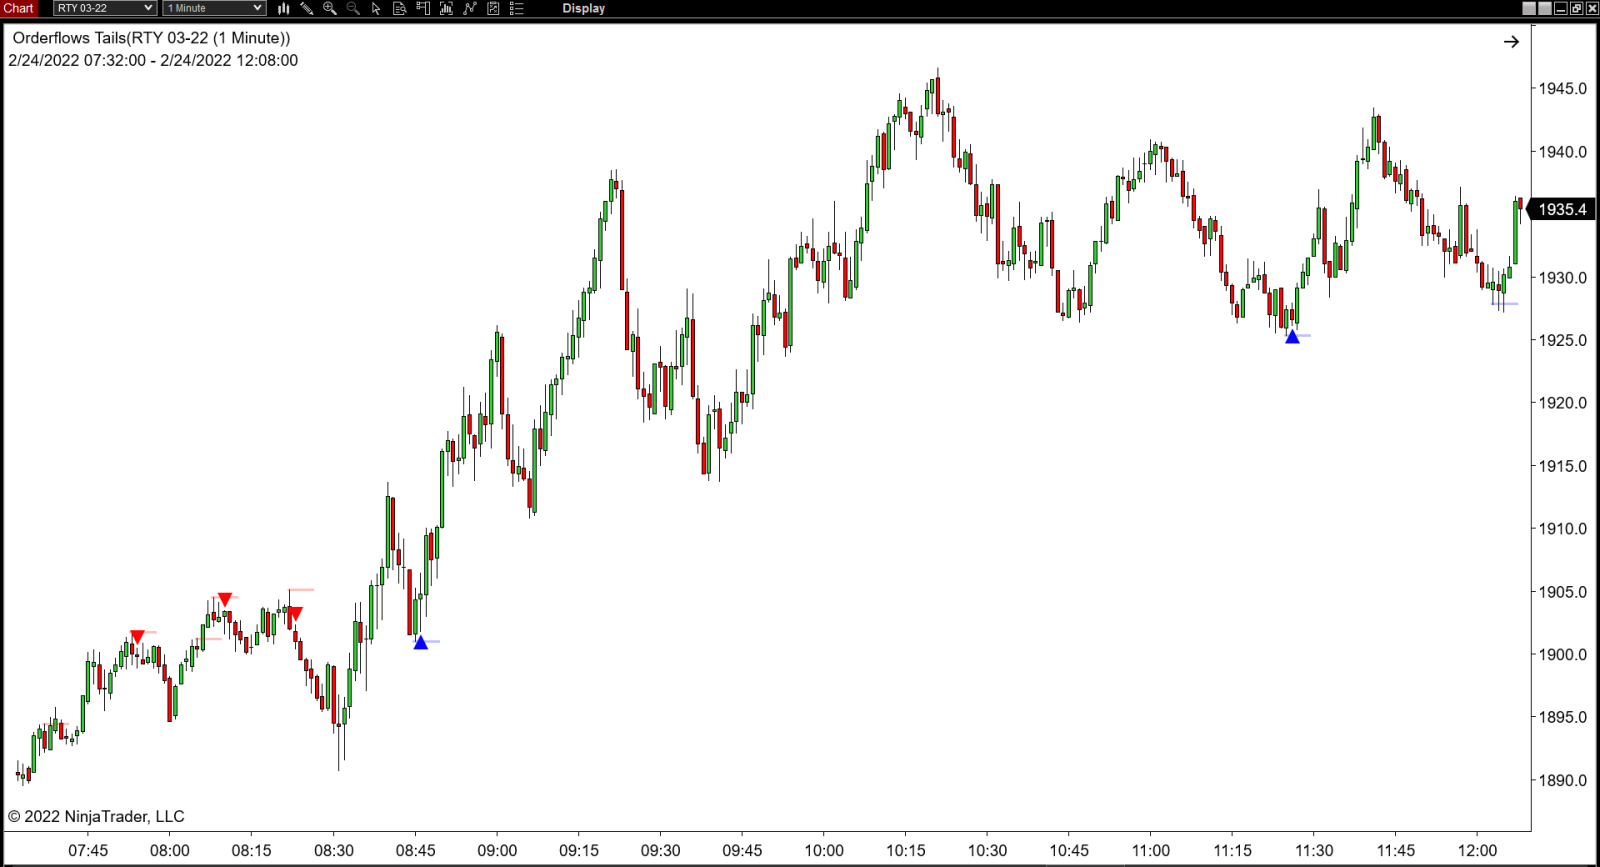
Let's Take A Look At Some Charts
Many of the best trading opportunities are hidden in what seems like a chaotic stream of market generated information.
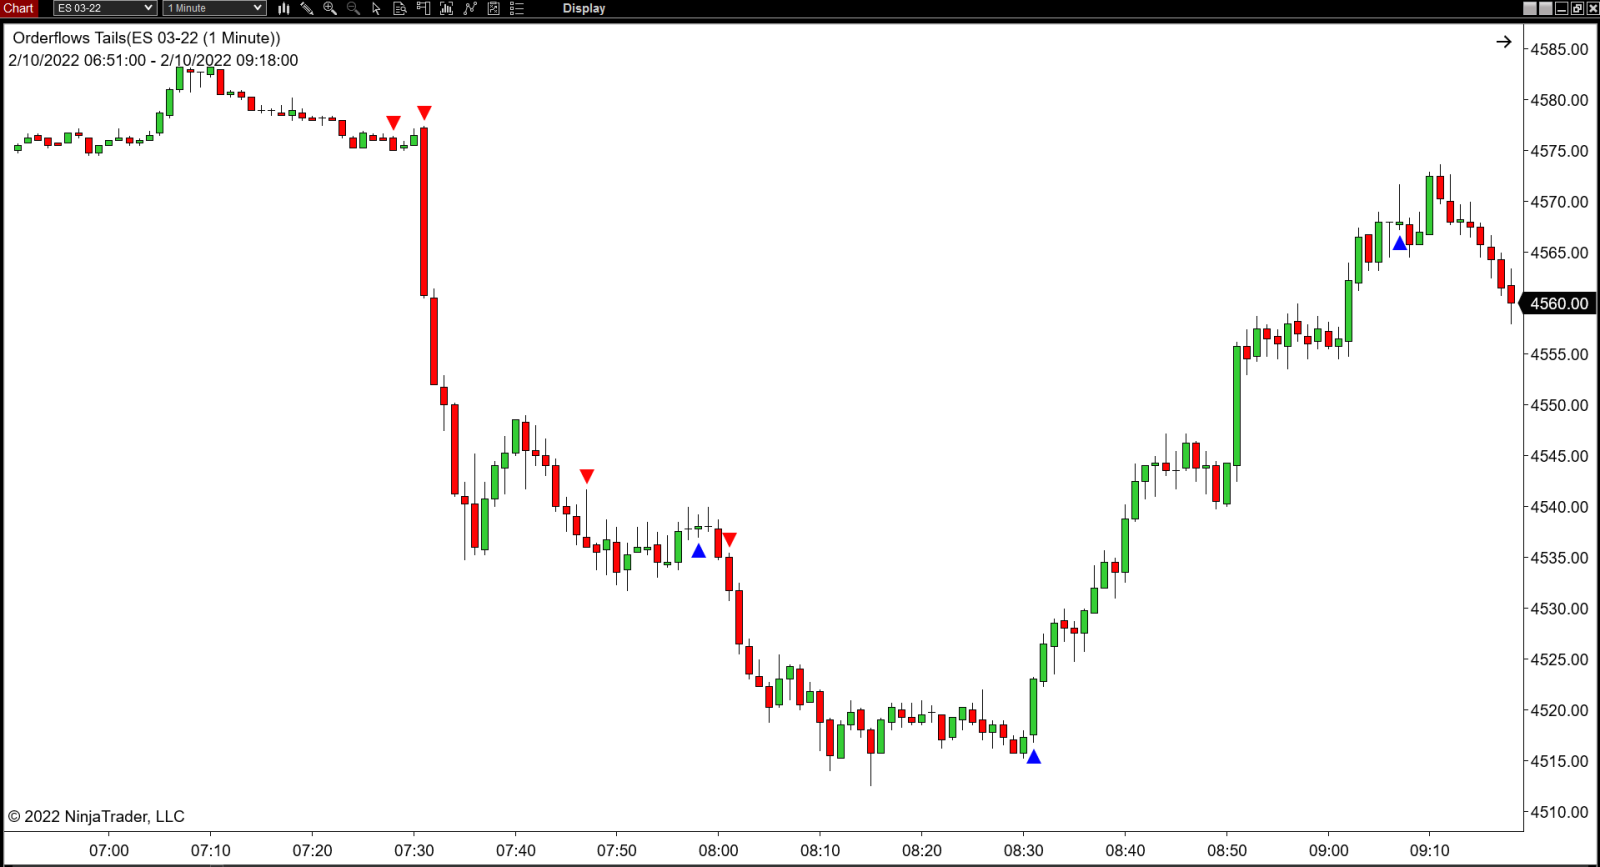
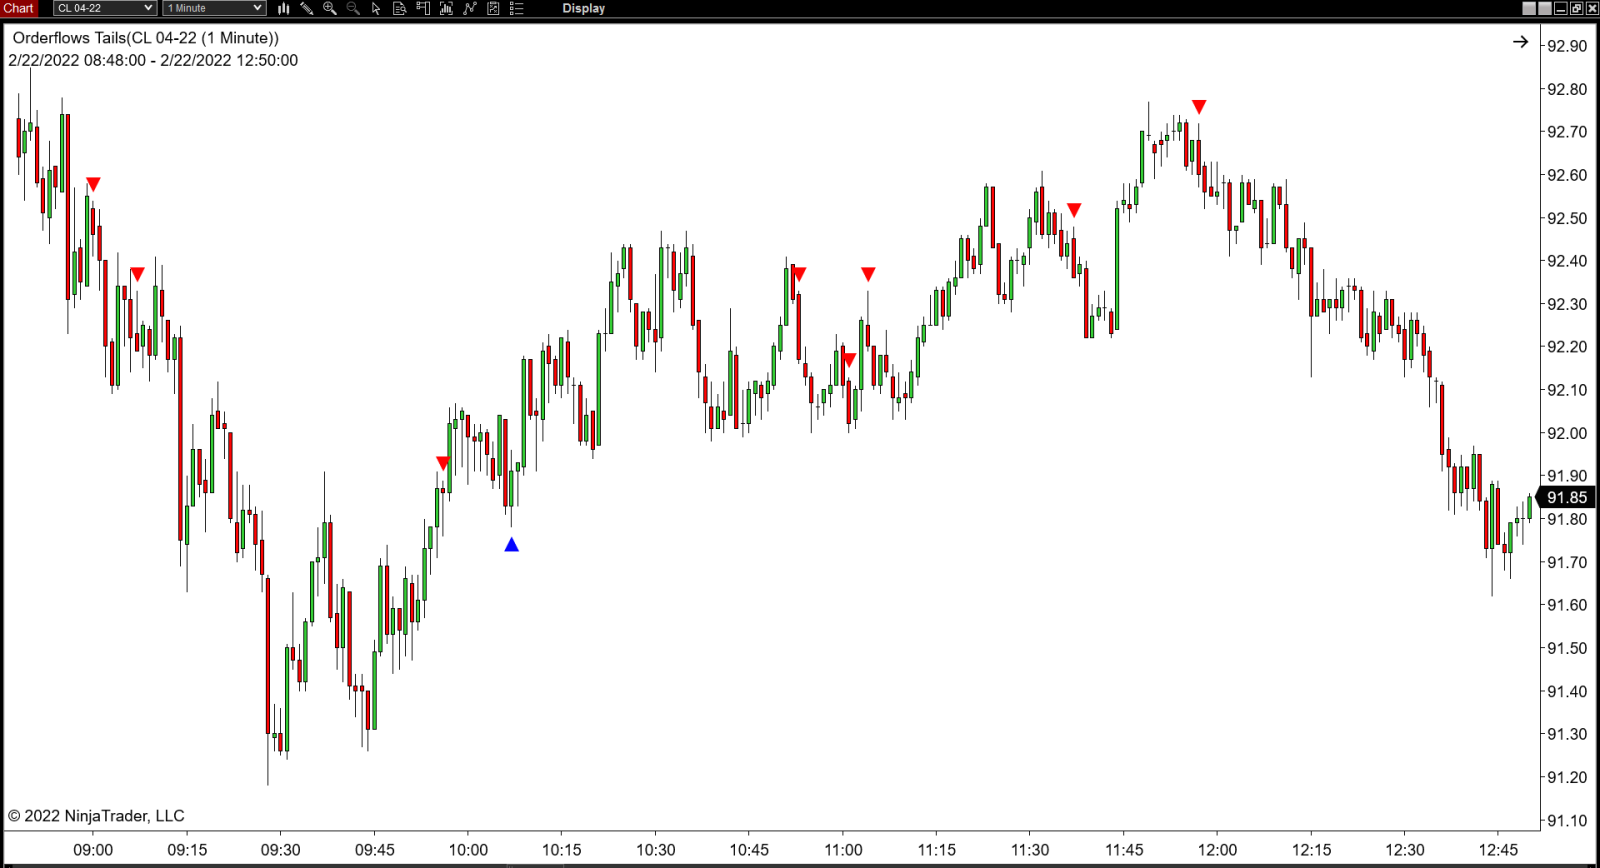

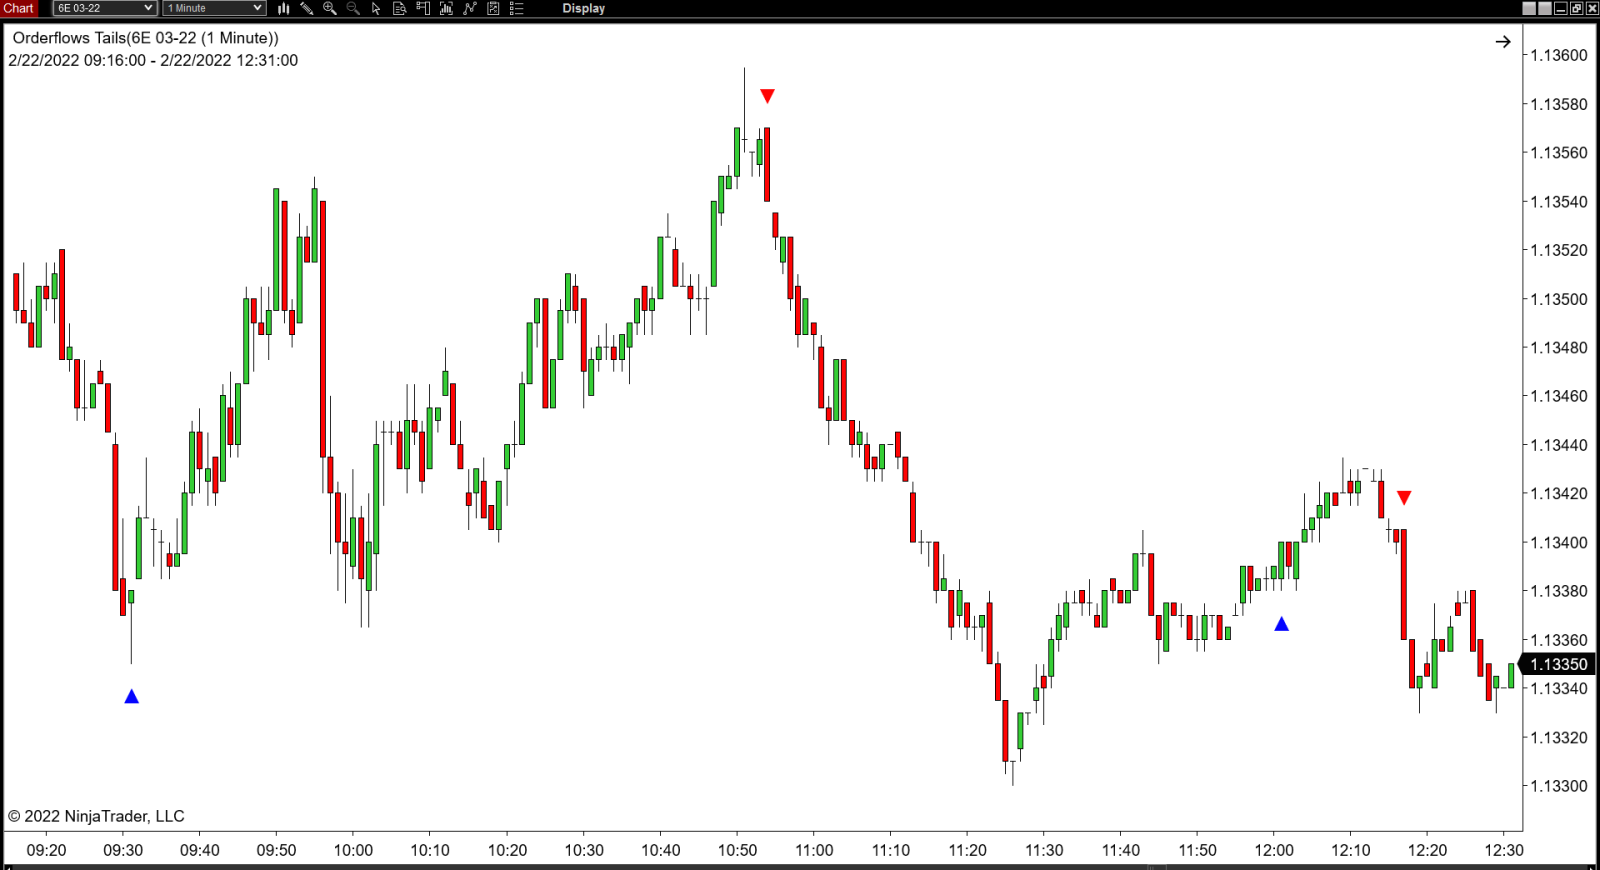
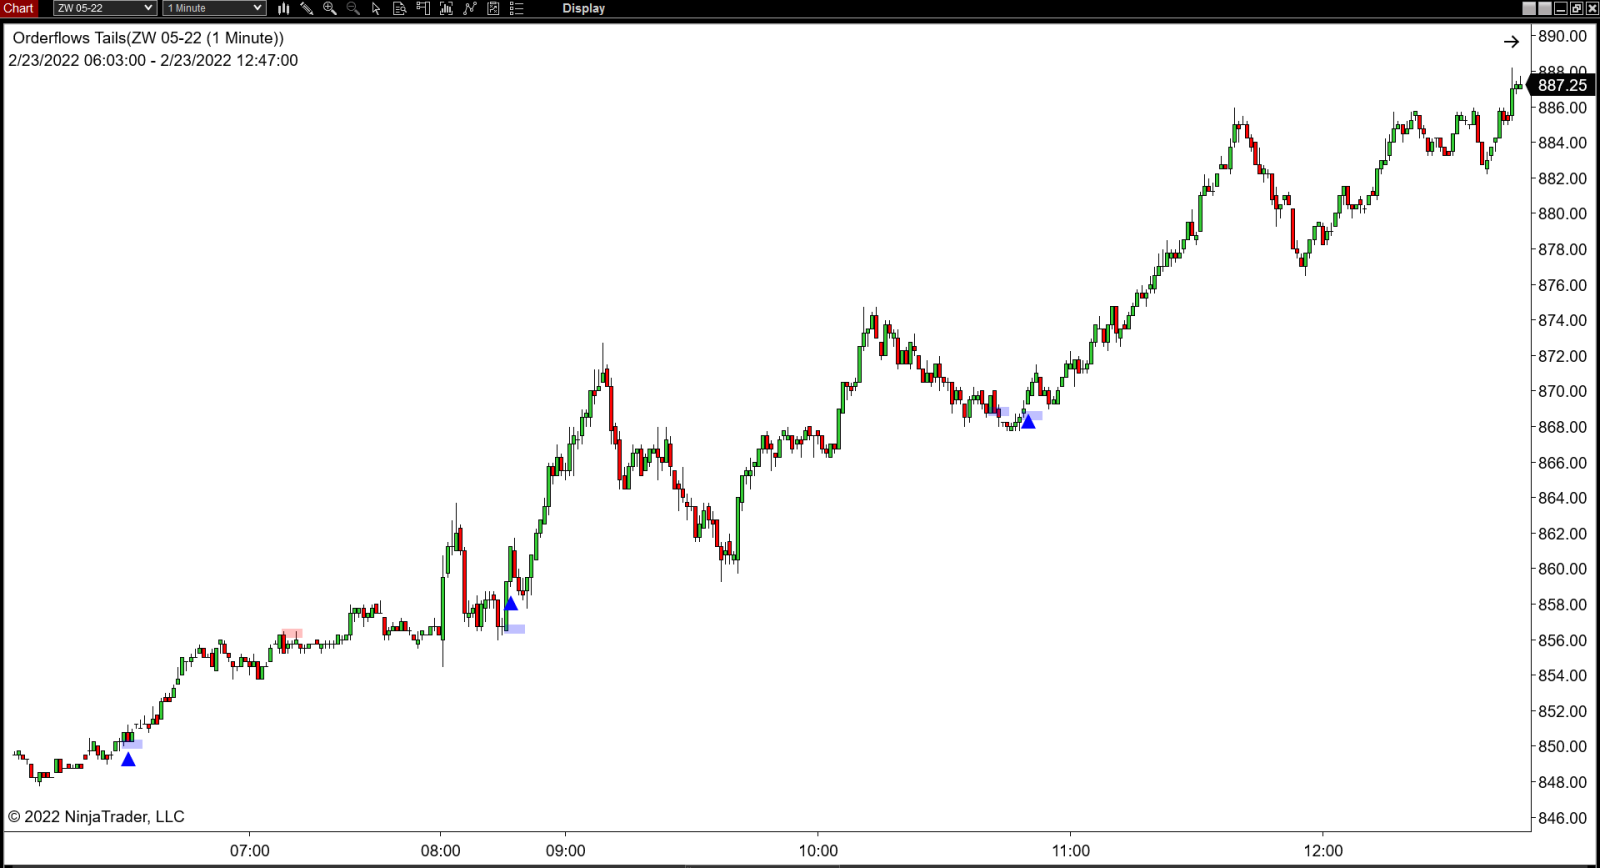
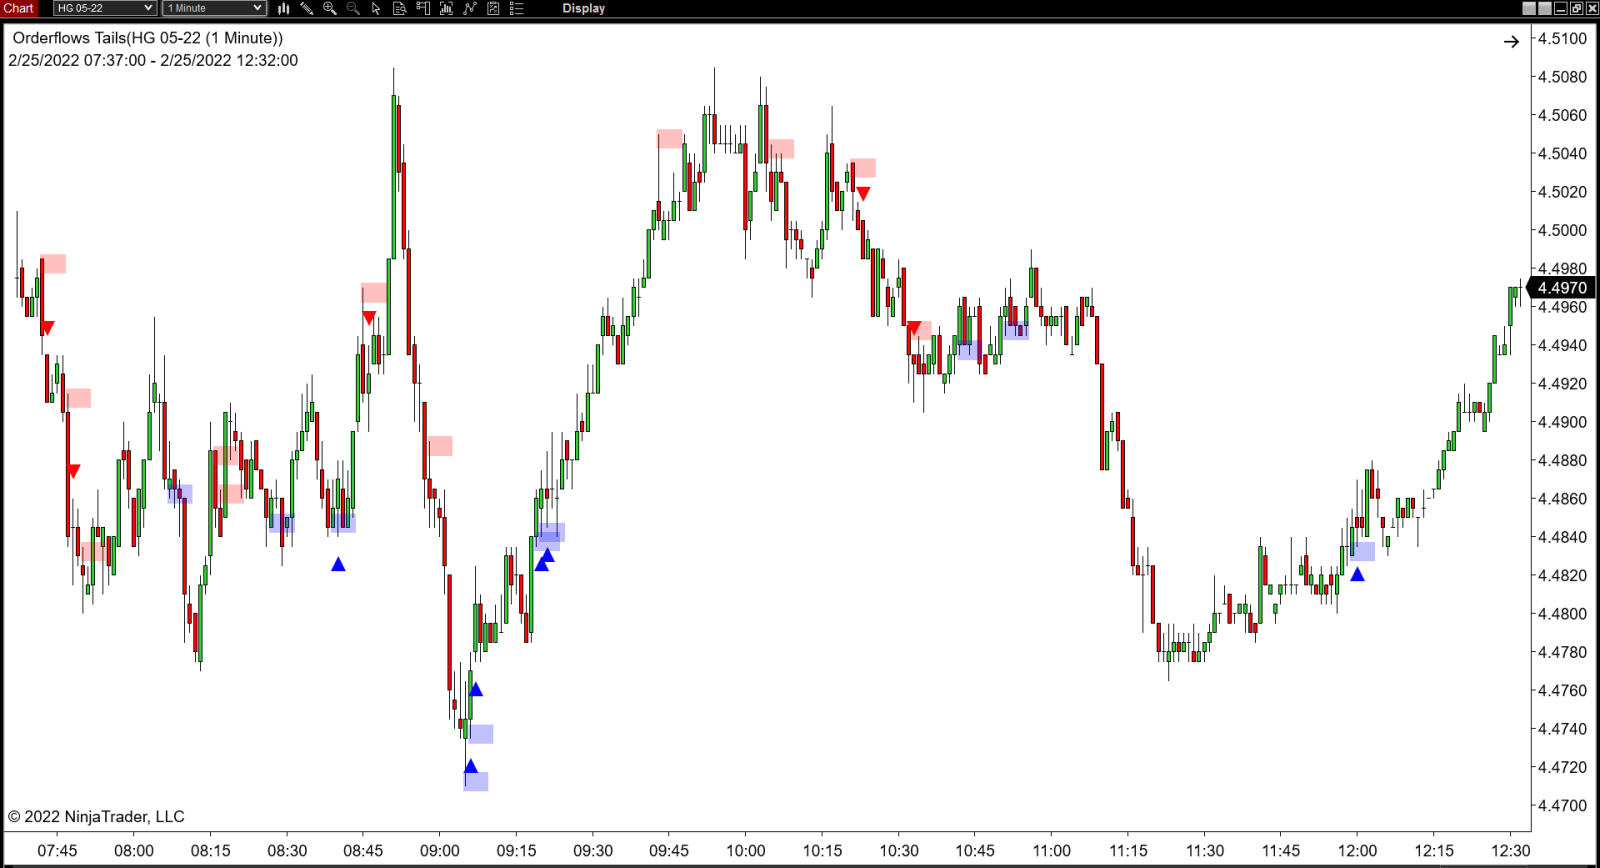
We have added the ability to draw out zones from when the Tail occurred so that you watch how the market reacts when the zone is revisited. When the market comes back to a previous tail level, many of the traders who got trapped originally are taking advantage of the pull back to cover.
Often times the market is coming back to a swing high/low and while there are some traders who are looking to get out of their losing trade, there is another group of traders looking for the market to break out past that swing high/low. Either way you will be ready to take advantage of the situation.
Tails are often revisited at some point because they are a sign of structural weakness. In other words, when a tail forms it is the result of a lack of symmetry in normal trading. There is a lack of two-sided trading that caused the tail.
The reason tails are revisited or repaired is because of there is poor structure that caused the tail and the market auction back to look again at this problematic price level.
awesome Features

Swing Filter
Trade with market context. When a tail occurs a trader should begin putting in context of the market. Is the tail occurring with or against the current trend of the market. If the tail is appearing against the current trend that is a sign of potential balancing (sideways activity) or more importantly the beginning of a reversal. The Swing filter allows you to take into account if the market is at a swing high or swing low, so you can take advantage of reversals
POC Filter
POC (Point of Control) is the price level in a bar where the most volume traded. In our years of trading, we have found that when the POC appears in a certain area in a bar it can be indicative of immediate support or resistance. We added the POC Filter to give traders the ability to see buying tails when the POC is showing potential support or selling tails when the POC is showing potential resistance. Think of this as an added safety blanket. This feature is not in the Orderflows Trader 5.0 because you can see when the POC is supportive or offering resistance on the chart, but if you are using a normal bar chart, you just don't see the POC so we added it the Orderflows Tails.
Value Area Filter
Value Area is the area in a bar where 70% (user configurable) of the volume traded. Value Area differs from POC which is only one price level. Value Area is a wider area. Markets spend their time looking for value to trade around. The Value Area filter looks specifically for bars where the Value Area is expanding as traders look for new value. This feature is meant to be used mostly in the more volatile markets such as YM, NQ, MNQ.
Sound Alert
A sound alert can be set so that when an Orderflows Tails appears you will be alerted with a sound. This is useful if you have multiple charts open and trade multiple markets.

Trade Entry Signal
The Trade Entry Signal is something I use in my trading. I use it to help me determine to take a trade or pass on the trade. It keeps me out of bad trades, the trades where there is no follow through order flow in the direction of the trade. If there is no follow through order flow, the probability the trade will work out is decreased and has a higher chance of failing.
Get Orderflows Tails now for just $397
Clicking on the order link will redirect you to our secure payment processor page on PayPal.
Please allow 3 to 6 hours for us to process your order. We will email you all the necessary files as soon as your order is processed.
Please allow 3 to 6 hours for us to process your order. We will email you all the necessary files as soon as your order is processed.
Frequently Asked Questions
LQ. Is the Orderflows Tails a footprint chart?
A. No. The Orderflows Tails is an order flow tools that analyzes all the data
you would normally see on a footprint chart - the delta, imbalances, POC and volume.
Q. Do I need a footprint chart to use the Orderflows Tails?
A. No, the Orderflows Tails will run on normal bar or candlestick chart as well as a footprint chart.
Q. What platform does the Orderflows Tails work on?
A. The Orderflows Tails is programmed for NinjaTrader 8.
Q. Do I need the PAID version of NinjaTrader 8 or can I use the FREE version?
A. The Orderflows Tails will run on the PAID version as well as the FREE version of NT8.
Q. I use Sierra Chart, is the Orderflows Tails available for Sierra Chart?
A. No. At the moment the Orderflows Tails is only available for NT8.
Q. I see you have different markets and different time frames, do I need to follow so many different markets?
A. No, I show you different markets and different chart types so you can see for yourself how the Orderflows Tails works under different conditions.
Q. Does the Orderflows Tails work with Markers Plus from The Indicator Store?
A. Yes it does.
Q. I trade Forex, can I use the Orderflows Tails to analyze FX markets?
A. Not really. Forex data is not centralized so analyzing order flow from various sources is not an ideal situation. If you want to trade Forex, I would suggest you trade the FX futures available at the CME where the data is centralized and better to analyze the order flow.
Q. What markets work best with Orderflows Tails?
A. Futures and stocks work best with the Orderflows Tails.
Q. What time frame is best for Orderflows Tails?
A. Order flow in generally is best for shorter time frames. If you trade anything from 30 second charts to 5 minutes, Orderflows Tails performs well. When you start analyzing order flow over 15 minutes, the order flow that happened earlier is not as relevant.
Q. Is there a sound alert?
A. Yes, there is a default sound alert that you can change to your own custom .wav file.
Even More Charts
AAPL Stock
MSFT Stock
RTY Futures
Wheat Futures
Copper Futures
A big advantage of analyzing order flow to understand the market is being able to create a strategy based on that understanding is that if a strategy turns out to be wrong it is very quickly apparent.
Click the button above to get started with Orderflows Tails.
Setting Up Orderflows Tails is Super Easy, just watch this video:
Copyright 2022 - Orderflows.Com & Orderflowstails.com - All rights reserved
CFTC Rules 4.41:
Hypothetical or Simulated performance results have certain limitations, unlike an actual performance record, simulated results do not represent actual trading. Also, since the trades have not been executed, the results may have under-or-over compensated for the impact, if any, of certain market factors, such as lack of liquidity. Simulated trading programs in general are also subject to the fact that they are designed with the benefit of hindsight. No representation is being made that any account will or is likely to achieve profit or losses similar to those shown.
Disclaimer:
This presentation is for educational and informational purposes only and should not be considered a solicitation to buy or sell a futures contract or make any other type of investment decision. Futures trading contains substantial risk and is not for every investor. An investor could potentially lose all or more than the initial investment. Risk capital is money that can be lost without jeopardizing ones financial security or life style. Only risk capital should be used for trading and only those with sufficient risk capital should consider trading. Past performance is not necessarily indicative of future results.
Risk Disclosure:
Futures and forex trading contains substantial risk and is not for every investor. An investor could potentially lose all or more than the initial investment. Risk capital is money that can be lost without jeopardizing ones’ financial security or life style. Only risk capital should be used for trading and only those with sufficient risk capital should consider trading. Past performance is not necessarily indicative of future results.
Hypothetical Performance Disclosure:
Hypothetical performance results have many inherent limitations, some of which are described below. no representation is being made that any account will or is likely to achieve profits or losses similar to those shown; in fact, there are frequently sharp differences between hypothetical performance results and the actual results subsequently achieved by any particular trading program. One of the limitations of hypothetical performance results is that they are generally prepared with the benefit of hindsight. In addition, hypothetical trading does not involve financial risk, and no hypothetical trading record can completely account for the impact of financial risk of actual trading. for example, the ability to withstand losses or to adhere to a particular trading program in spite of trading losses are material points which can also adversely affect actual trading results. There are numerous other factors related to the markets in general or to the implementation of any specific trading program which cannot be fully accounted for in the preparation of hypothetical performance results and all which can adversely affect trading results.
Thanks for subscribing. Share your unique referral link to get points to win prizes..
Loading..